Letzte Werte als Reading und Balkendiagramm: Unterschied zwischen den Versionen
K (Überschriften korrigiert) |
K (Noch eine Überschrift korrigiert) |
||
| Zeile 59: | Zeile 59: | ||
[[Datei:FS20-PIR-Sensor Historie der letzten zehn Werte.png|Screenshot des PRI Sensors mit UserReading History|800px]] | [[Datei:FS20-PIR-Sensor Historie der letzten zehn Werte.png|Screenshot des PRI Sensors mit UserReading History|800px]] | ||
= History Funktionen in 99_myUtils.pm auslagern= | == History Funktionen in 99_myUtils.pm auslagern == | ||
Nutzt man diese Funktion öfters, bietet es sich an die Funktionen in die Datei [[99_myUtils_anlegen]] auszulagern. | Nutzt man diese Funktion öfters, bietet es sich an die Funktionen in die Datei [[99_myUtils_anlegen]] auszulagern. | ||
Version vom 11. Juli 2023, 17:48 Uhr
Letzte Werte als Reading und Balkendiagramm
Ein userReading der letzen N-Werte eines Readings des Devices beim Device selbst zu speichern geht wie folgt:
Beispiel, die letzten 10 Werte des State des Devices sollen in dem eigenem Reading "history10" gespeichert werden:
history10 {
    my $val = ReadingsVal("$name", "state", "???");
    my $ts = ReadingsTimestamp("$name", "state", undef);

    my $this = ReadingsVal("$name", "$reading", "");
    my $length = ($reading =~ /(\d+)/g)[-1];
    my @timestampArray = split("\n", $this);

    #optional: if ($timestampArray[-1] eq "$ts: $val") { return; }
    #optional: statt "history10" einfach "history10:state.*" als Readingnamen wählen
    push(@timestampArray, "$ts: $val");
    while ( scalar @timestampArray > $length ) { shift(@timestampArray); }

    my $serializedArray = join("\n", @timestampArray);
    return $serializedArray;
}
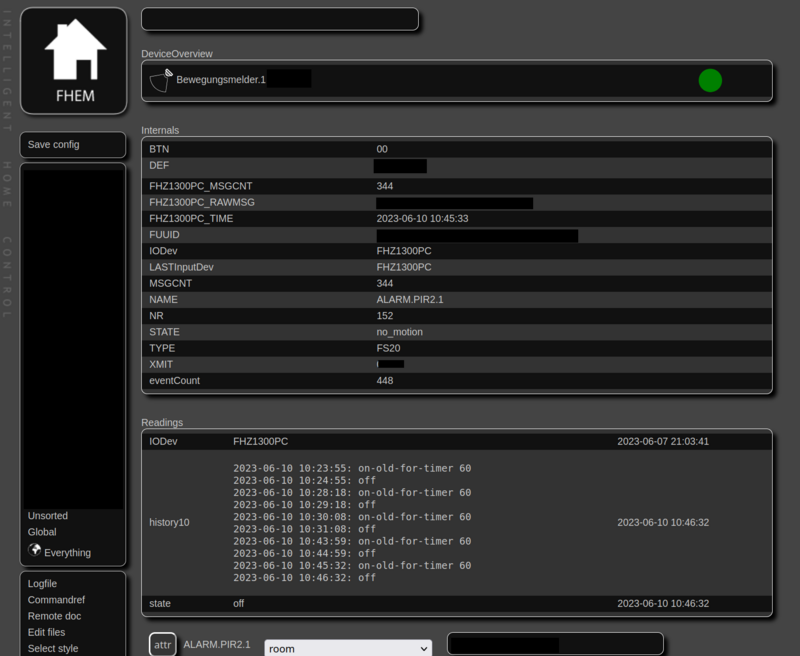
Wie lang die History sein soll, also wieviele Einträge gespeichert werden sollen, das wird mit der Zahl im userReadings Namen festgelegt. Der Output sieht dann bei einem PIR Sensor des FS20 Systems zum Beispiel so aus:
2023-06-07 20:06:37: off
2023-06-07 20:06:48: on-old-for-timer 60
2023-06-07 20:07:48: off
2023-06-07 20:25:16: on-old-for-timer 60
2023-06-07 20:25:46: on-old-for-timer 60
2023-06-07 20:26:46: off
2023-06-07 20:27:46: on-old-for-timer 60
2023-06-07 20:28:46: off
2023-06-07 20:39:53: on-old-for-timer 60
2023-06-07 20:40:53: off
Um das Beispiel eines PIR-Bewegungsmelders aus dem FS20 System abzuschließen, folgt die Definition des gesamten Device:
defmod ALARM.PIR2.1 FS20 1234 00
attr ALARM.PIR2.1 IODev FHZ1300PC
attr ALARM.PIR2.1 follow-on-for-timer 1
attr ALARM.PIR2.1 icon motion_detector
attr ALARM.PIR2.1 model fs20piri
attr ALARM.PIR2.1 userReadings history10 {\
    my $val = ReadingsVal("$name", "state", "???");;\
    my $ts = ReadingsTimestamp("$name", "state", undef);;\
    \
    my $this = ReadingsVal("$name", "$reading", "");;\
    my $length = ($reading =~ /(\d+)/g)[-1];;\
    my @timestampArray = split("\n", $this);;\
    \
    push(@timestampArray, "$ts: $val");;\
    while ( scalar @timestampArray > $length ) { shift(@timestampArray);; }\
    \
    my $serializedArray = join("\n", @timestampArray);;\
    return $serializedArray;;\
}
Um es zu verdeutlichen ein Foto des Device:
History Funktionen in 99_myUtils.pm auslagern
Nutzt man diese Funktion öfters, bietet es sich an die Funktionen in die Datei 99_myUtils_anlegen auszulagern.
Die erste Funktion dient dem Speichern der Historie:
  ###############################################################################
  #
  #  push new value to list of type "timestamp: value\n", keep length by shifting
  #
  ###############################################################################
  sub pushTimestampValueArray($$$;$) {
    my ($values, $newTimestamp, $newValue, $length) = @_;

    $length = $length // 10;

    my @timestampArray = split("\n", $values);

    # Do not add to history if not new info
    if ($timestampArray[-1] eq "$newTimestamp: $newValue") {
        return;
    }
    if ($newValue eq ($timestampArray[-1] =~ /^\d{4}-\d{2}-\d{2} \d{2}:\d{2}:\d{2}: (.*)$/)[0]) {
        return;
    }

    push(@timestampArray, "$newTimestamp: $newValue");
    while (scalar @timestampArray > $length) {
        shift(@timestampArray);
    }

    my $serializedArray = join("\n", @timestampArray);
    return $serializedArray;
  }
Die zweite Funktion kann die Historie in dem Logformat als Balkendiagram darstellen:
  ###############################################################################
  #
  #  Consume a string with lines like: Timestamp: value
  #  return HTML to show the history visually
  #
  ###############################################################################
  sub historyToHTML($;$) {
    my ($values, $interval) = @_;
    my @values = split("\n", $values);
    return "Could not split values" unless @values;

    #if no interval given, use whole history, do not "shift" out old values
    my $start_time;
    if (not defined $interval) {
        my ($timestampStr) = ($values[0] =~ /^(\d{4}-\d{2}-\d{2} \d{2}:\d{2}:\d{2}): .*$/)[0];
        return "Could not parse timestamp" unless defined $timestampStr;
        $start_time = time_str2num($timestampStr);
    } else {
        $start_time = time() - $interval;
    }

    #colors too choose from:
    my @colors = (
        '#f44336', '#f44336', '#2196f3', '#03a9f4', '#00bcd4',
        '#009688', '#4caf50', '#8bc34a', '#cddc39', '#ffeb3b',
        '#ffc107', '#ff9800', '#ff5722', '#9e9e9e', '#2196f3',
        '#607d8b', '#9c27b0', '#673ab7', '#3f51b5', '#e91e63',
        '#00e676', '#ff5722', '#ffeb3b', '#00bcd4', '#8bc34a',
        '#607d8b', '#9e9e9e', '#795548'
    );
    #colors that should have a certain mapping of value->color:
    my %color_map = (
        "on" => "#a4c639",               # Yellowish or Green
        "off" => "#3c3c3c",              # Darker, Matted Toned
        "on-old-for-timer 60" => "#ffa500",  # Orange
        "no_motion" => "#4caf50",        # Green
        "motion" => "#f44336",           # Red
        "offline" => "#f44336"           # Red
    );

    #go through the array, but from highest index to lowest, keep it however in the initial order
    @values = reverse map {
        my ($fullvalue, $timestampStr, $value) = ($_, $_ =~ /^(\d{4}-\d{2}-\d{2} \d{2}:\d{2}:\d{2}): (.*)$/);
        my $timestamp = time_str2num($timestampStr);

        #choose color
        if (not exists $color_map{$value}) {
            my $color_index = join('', map { ord($_) } split('', $value)) % scalar(@colors);
            $color_map{$value} = $colors[$color_index];
        }

        #fill hash with values
        {
            'timestamp' => $timestamp,
            'outdated' => ($timestamp < $start_time)?1:0,
            'timestampStr' => $timestampStr,
            'value' => $value,
            'fullvalue' => $fullvalue,
            'color' => $color_map{$value}
        }
    } reverse @values;

    #iterate from last to earlier items
    my $i;
    for ($i = $#values; $i > 0; $i--) {
        last if ($values[$i]->{outdated});

        my $duration=0;
        if ($values[$i-1]->{'outdated'}) {
            #calculate duration from start of this timeframe
            $duration = $values[$i]->{'timestamp'} - $start_time;
        } else {
            #calculate the duration the state was valid for
            $duration = $values[$i]->{'timestamp'} - $values[$i-1]->{'timestamp'};
        }
        $values[$i-1]->{'duration'} = round($duration, 0);
    }
    #special handling of most recent item, always assign 1s
    $values[-1]->{'duration'} = time() - $values[-1]->{'timestamp'};
    $values[-1]->{'duration'} = round($values[-1]->{'duration'}, 0);
    #$values[-1]->{'duration'} = 1;
    $values[-1]->{'mostRecentItem'} = 1;

    #just work with the values from the interval
    my @valuesToKeep = grep { $_->{'outdated'} == 0 } @values;
    #add the last outdated element to the front
    unshift(@valuesToKeep, $values[$i]) if (scalar(@valuesToKeep) != scalar(@values));

    #return Data::Dumper::Dumper(\@valuesToKeep);

    my $grid = "<div class=\"historyGrid\" style=\"border: 1px solid white;".
    "border-radius: 5px; display: grid;".
    "color: white; text-align: center; align-items: center;".
    "width: 500px; grid-template-columns:";
    foreach my $item (@valuesToKeep) {
        $grid .= "$item->{duration}fr ";
    }
    $grid .= ";\" ".
    "data-startTime=$start_time ".
    "data-interval=". ($interval // "NaN") .">";

    # Generate <div> elements with inline CSS style
    my $grid_elements = '';
    foreach my $entry (@valuesToKeep) {
        $grid_elements .= "<div style=\"background: $entry->{'color'}; ".
        "border-right: white 0px solid; height: 100%; overflow: hidden; ".
        "white-space: nowrap; text-overflow: clip; min-width: 1px;\" ".
        "class=\"zoom\" ".
        "data-timestamp=". round($entry->{'timestamp'}, 0) ." ".
        "title=\"$entry->{'fullvalue'}\">".
        "$entry->{'value'}<br>($entry->{'timestampStr'})</div>";
    }

    #Script to animate from the current time onwards
    my $script = <<"JS";
    <script>
        var styleContent = `
                .zoom {
                    transition: min-width .5s ease-in, color .5s ease-in !important;
                }
                .zoom:hover {
                    min-width: max-content !important;
                    color: white !important;
                }
                .zoom:hover + div {
                    min-width: 16px !important;
                }
                .historyGrid:hover > :not(.zoom:hover, .zoom:hover ~ .zoom) {
                    min-width: 2px !important;
                }
        `;

        /* add or update our CSS to the head */
        var styleElement = document.getElementById("historyGridCSS");
        if (!styleElement) {
            styleElement = document.createElement('style');
            styleElement.id = "historyGridCSS";
            document.head.appendChild(styleElement);
        }
        styleElement.textContent = styleContent;

        /* just keep one timer for our purposes */
        if (window.historyGridIntervalTimer) {
            clearInterval(window.historyGridIntervalTimer);
        }

        /* this function adjusts the div sizes based on time */
        var updateValue = function() {
            /* there might be several copies of this element, work with classes */
            var historyGridItems = document.getElementsByClassName('historyGrid');
            var currentTimestamp = Date.now() / 1000;

            /* work on each individual historyGrid */
            for (var i = 0; i < historyGridItems.length; i++) {
                var historyGrid = historyGridItems[i];
                var columns = historyGrid.style.gridTemplateColumns.split(' ');

                /* 1 fr equals 1 second here, adjust the most recent item */
                var timestampLastItem = historyGrid.lastChild.dataset.timestamp;
                columns[columns.length - 1] = (currentTimestamp - timestampLastItem) + 'fr';

                /* adjust the other item sizes if not whole history is to be shown */
                if (historyGrid.dataset.interval != "NaN") {
                    var start_at = currentTimestamp - parseInt(historyGrid.dataset.interval);

                    /* adjust the first and next child-div, the last has been adjusted above */
                    for (var j = 0; j < columns.length-1; j++) {
                        var thisEntry = historyGrid.children[j];
                        var nextEntry = historyGrid.children[j+1];

                        var thisTimestamp = Math.max(0, thisEntry.dataset.timestamp-start_at);
                        var nextTimestamp = Math.max(0, nextEntry.dataset.timestamp-start_at);

                        /* 0fr is OK for outdated items, item is still in the DOM, but 0-sized */
                        columns[j] = Math.max(0, nextTimestamp-thisTimestamp) + 'fr';

                        /* if 0fr then unset min-width inline style of the div */
                        if (columns[j] === '0fr') {
                            thisEntry.style.minWidth = '';
                        }
                    }
                }

                /* put together the grid-size-info again and apply */
                historyGrid.style.gridTemplateColumns = columns.join(' ');
            }

            /* if the text does not fit, hide the text without deleting it */
            var divElements = document.querySelectorAll('.historyGrid > div');
            divElements.forEach(function(element) {
                if (element.scrollWidth > element.clientWidth) {
                    element.style.color = 'transparent';
                } else {
                    element.style.color = '';
                }
            });

            /* the most recent log entry (the last) is too small to be seen,
               so, make it larger and maintain aspect ratio of 1:1
             */
            var elements = document.querySelectorAll('.historyGrid > div:last-child');
            elements.forEach(function(element) {
              element.style.minWidth = element.offsetHeight + 'px';
              if (element.offsetWidth > parseInt(element.style.minWidth) + 2) {
                element.style.borderLeft = '0px solid white';
              } else {
                element.style.borderLeft = '2px dashed white';
              }
            });
        };

        /* immiditaly update sizes right now and set intervalTimer */
        updateValue();
        window.historyGridIntervalTimer = setInterval(updateValue, 1000);
    </script>
JS
    #remove newlines, because this confuses FHEMs handling of HTML content
    $script =~ s/\n//g;

    return "<html>$grid".$grid_elements."</div>".$script."</html>";
    }
Visuelle Darstellung als Balkendiagramm
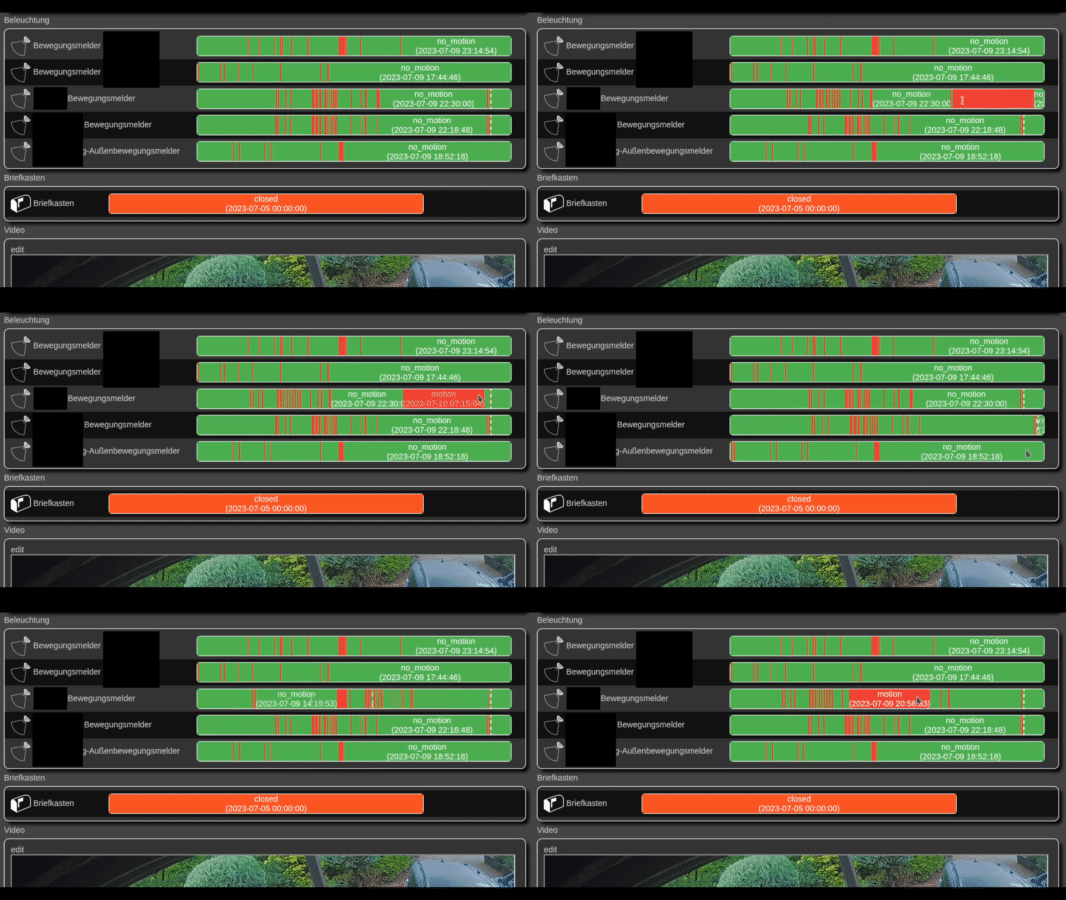
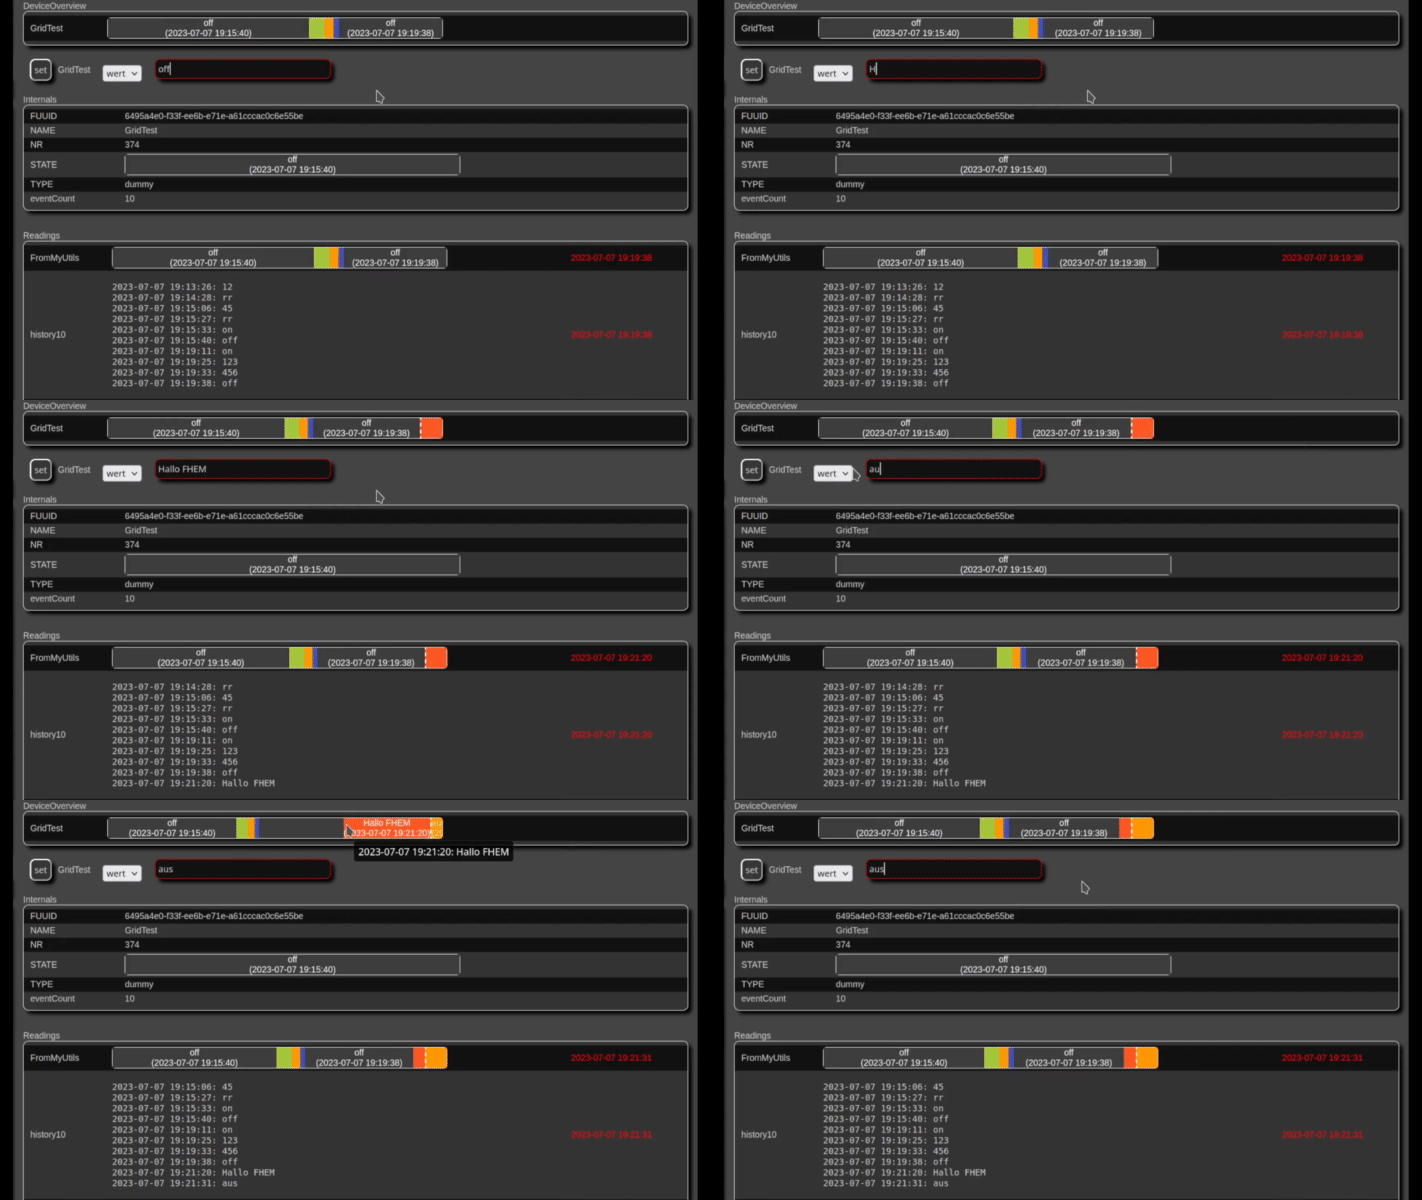
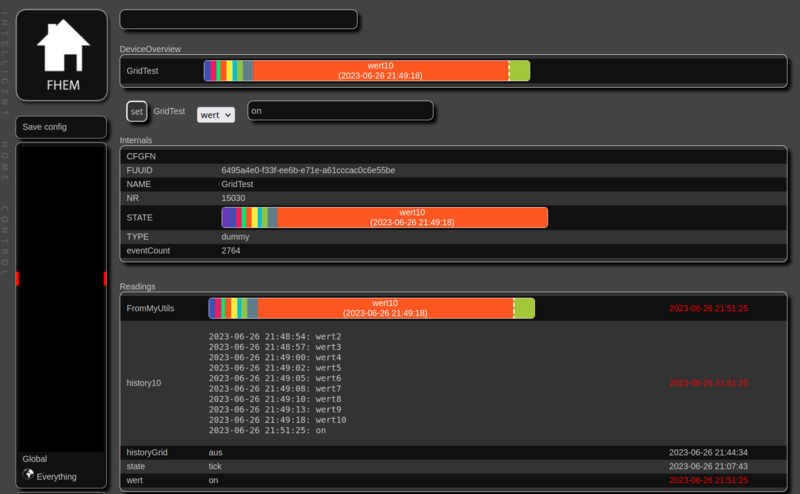
Hat man einmal die Historie, kann man diese nun auch animiert darstellen. Eine DB oder Logdatei braucht man dabei nicht.
Mit einem Testdevice kann man es wie folgt nutzen:
defmod GridTest dummy
attr GridTest readingList wert
attr GridTest setList wert
attr GridTest stateFormat FromMyUtils
attr GridTest userReadings history10:wert.* {\
    my $val = ReadingsVal("$name", "wert", "???");;\
    my $ts = ReadingsTimestamp("$name", "wert", undef);;\
    \
    my $this = ReadingsVal("$name", "$reading", "");;\
    my $length = ($reading =~ /(\d+)/g)[-1];;\
    my @timestampArray = split("\n", $this);;\
    \
    #do not add to history if not new info\
    if ($timestampArray[-1] eq "$ts: $val") { return;; }\
    if ($val eq ($timestampArray[-1] =~ /^\d{4}-\d{2}-\d{2} \d{2}:\d{2}:\d{2}: (.*)$/)[0]) { return;; }\
    #optional: statt "history10" einfach "history10:state.*" als Readingnamen wählen\
    \
    push(@timestampArray, "$ts: $val");;\
    while ( scalar @timestampArray > $length ) { shift(@timestampArray);; }\
    \
    my $serializedArray = join("\n", @timestampArray);;\
    return $serializedArray;;\
},\
FromMyUtils:wert.* {\
    my $values = ReadingsVal("$name", "history10", "");;\
    \
    #zeige nur die letzten 5 Minuten (=300s)\
    return historyToHTML($values, 5*60);;\
    \
    #zeige all Einträge aus der Historie\
    #return historyToHTML($values);;\
}
Alternativen
Alternativ ist auch ReadingsHistory oder OldReadingsVal bzw. oldreadings interessant.
Falls man die Werte in ein DBLog speichert, kann man die letzten Werte auch abrufen:
get <DbLogDevice> retrieve last <deviceName> <readingName> "" "" "" 10
Forumsposts zu dem Thema
Inspiration: https://forum.fhem.de/index.php?topic=133819.msg1277715#msg1277715
CodeSnippet: https://forum.fhem.de/index.php?topic=133885.msg1278240#msg1278240


